Wavelength Conversion Fiber (plastic optical fiber)
Wavelength conversion fiber (WLS) is a fiber that absorbs light and re-emits it at a different wavelength to increase light-receiving efficiency. This page lists the lineup (absorption/emission peaks and attenuation lengths) and spectral data.
Functions & Features
Wavelength conversion fiber (WLS) is a plastic optical fiber that absorbs light and re-emits it as a longer wavelength light, helping to improve light receiving efficiency and light guiding distance. The multilayer structure consists of a core of polystyrene resin containing a fluorescent agent and a methacrylic resin cladding, which efficiently conducts the luminescence of the scintillator and other components to the detection system.
Wavelength Conversion
Photosensitive Efficiency
Light Guide Distance
Lineup (Grade Specifications)
Points of comparison: Absorption peak (uptake) / Emission peak (compatibility with light-receiving element) / Attenuation length (approximate light-conducting distance)
| Description | Emission | Absorption Peak [nm] | Att.Leng. [m] | Characteristics | |
| Color | Peak [nm] | ||||
| B-2 (200) | blue | 473 | 375 | >3.5 | UV to Blue Shifter |
| B-3 (200) | blue | 450 | 351 | >4.0 | |
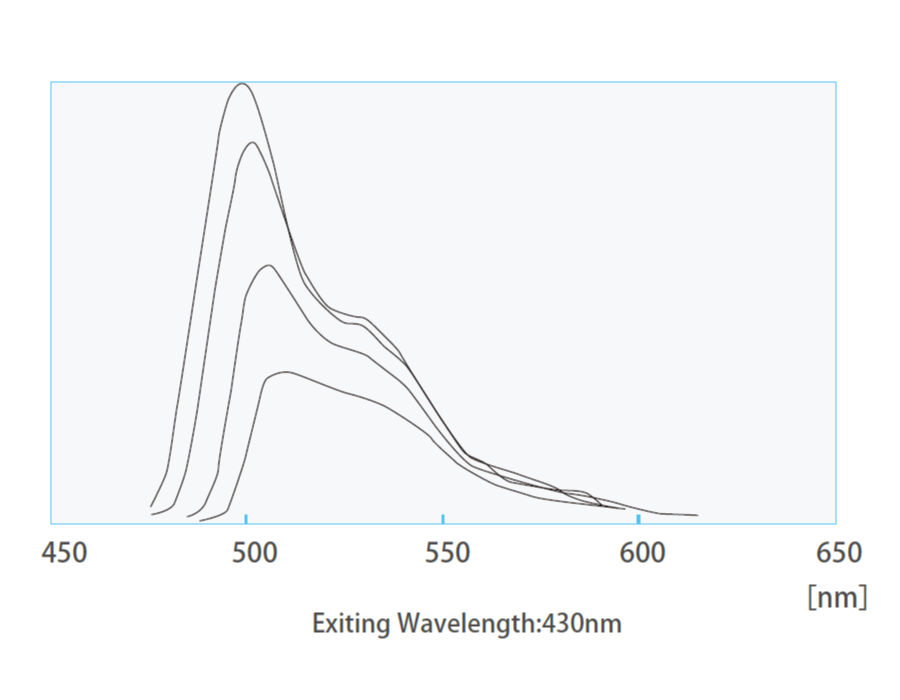
| Y-8 (100) | green | 511 | 455 | >3.0 | Blue to Green Shifter |
| Y-11 (200) | green | 476 | 430 | >3.5 | |
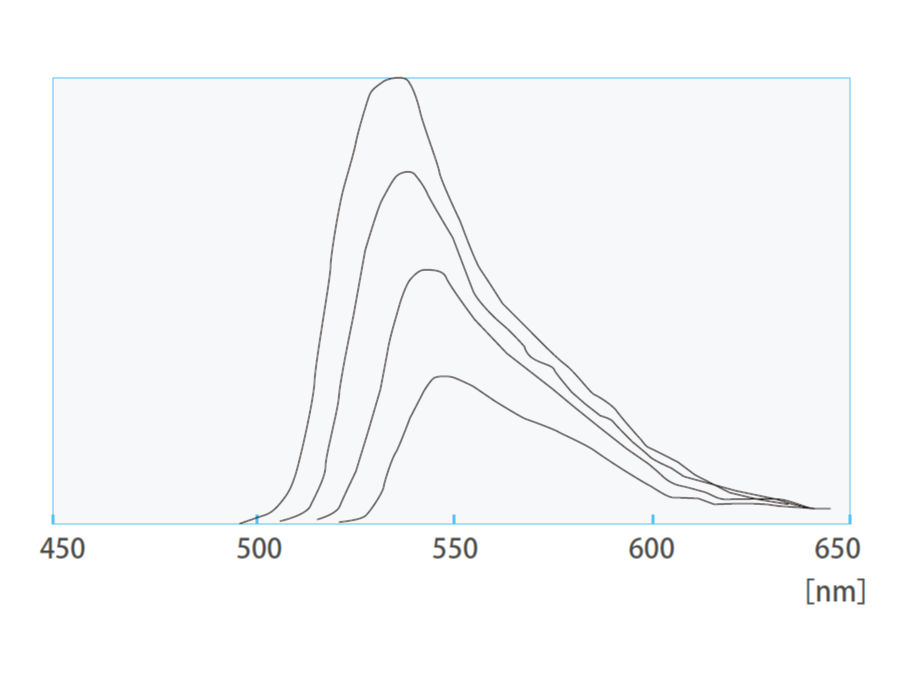
| O-2 (100) | orange | 550 | 535 | >1.5 | Green to Orange Shifter |
| R-3 (100) | red | 610 | 577 | >2.0 | Green to Red Shifter |
| YS-1 | green | 454 | 395 | >3.5 | |
| YS-2 | green | 474 | 422 | >3.5 | |
| YS-4 | green | 470 | 420 | >3.0 | |
| YS-6 | green | 462 | 414 | >3.0 | |
The data shown are representative values for comparative study. Values may vary depending on measurement conditions. Not a guaranteed value.
*Presented data: 1 mmφ, multi-clad, Non-S type measured values
Fermilab Nova

Wavelength conversion fiber is also used in the "NOvA (Nova) Experiment" at the Fermilab (Fermi National Accelerator Laboratory) in the United States. The NOvA experiment is a large-scale project to elucidate the properties of neutrinos, which are involved in the formation of the universe and matter, and the properties of this product play an important role in its detectors.
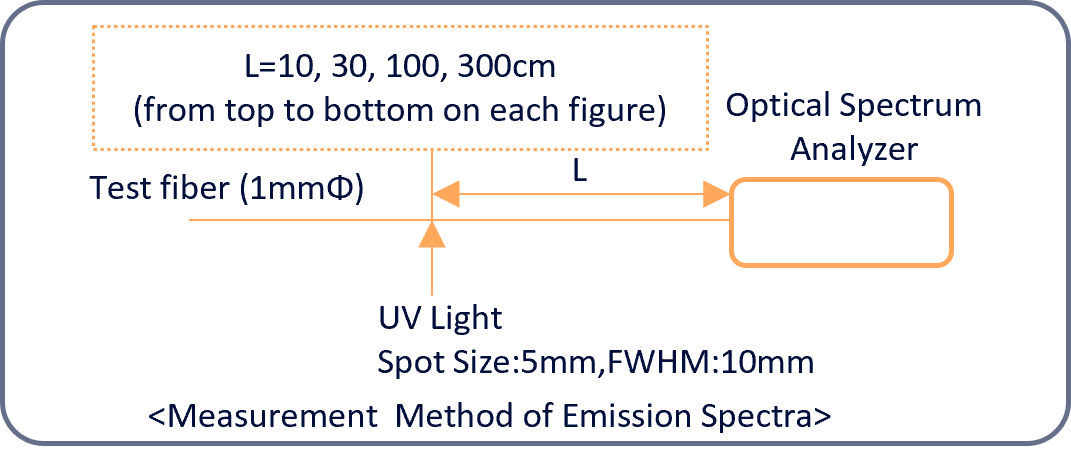
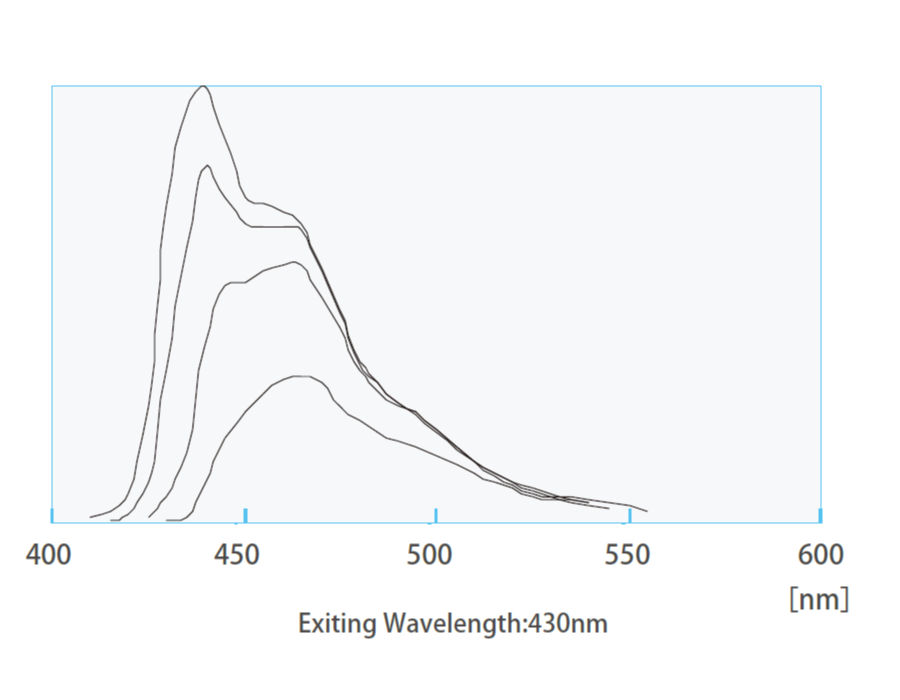
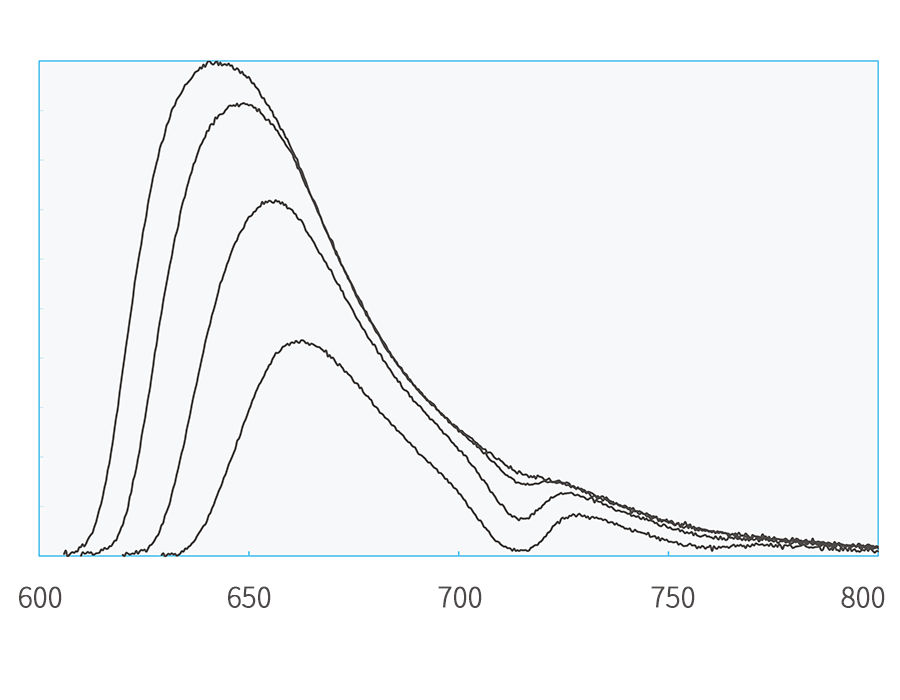
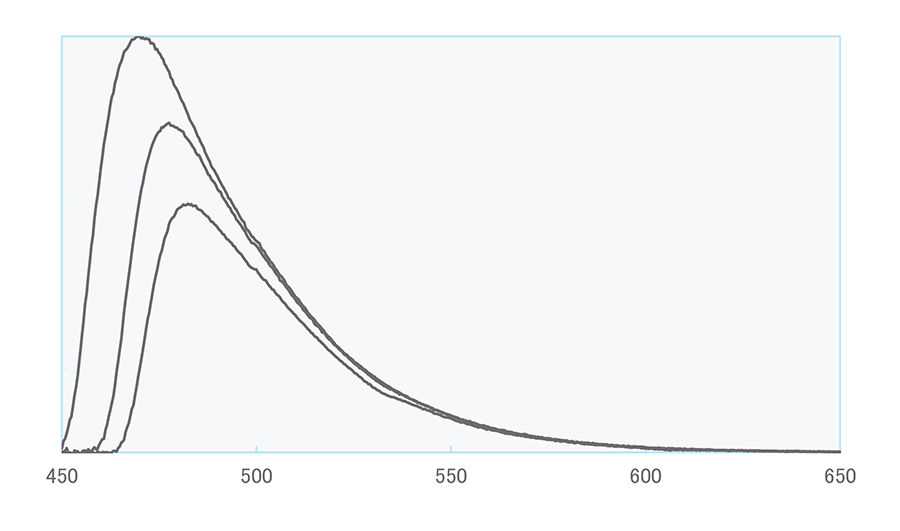
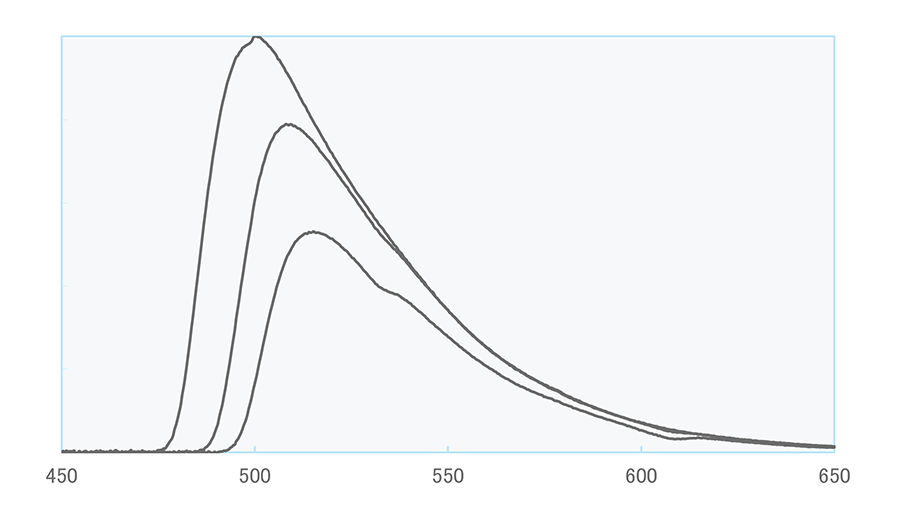
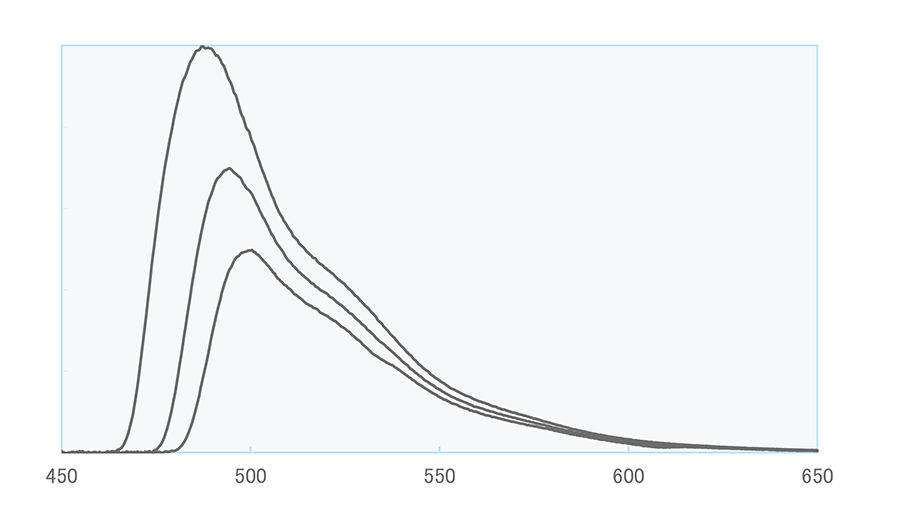
Emission Spectrum
The data shown are representative values for comparative study. Values may vary depending on measurement conditions. Not a guaranteed value.
B-2 (200)
B-3 (200)
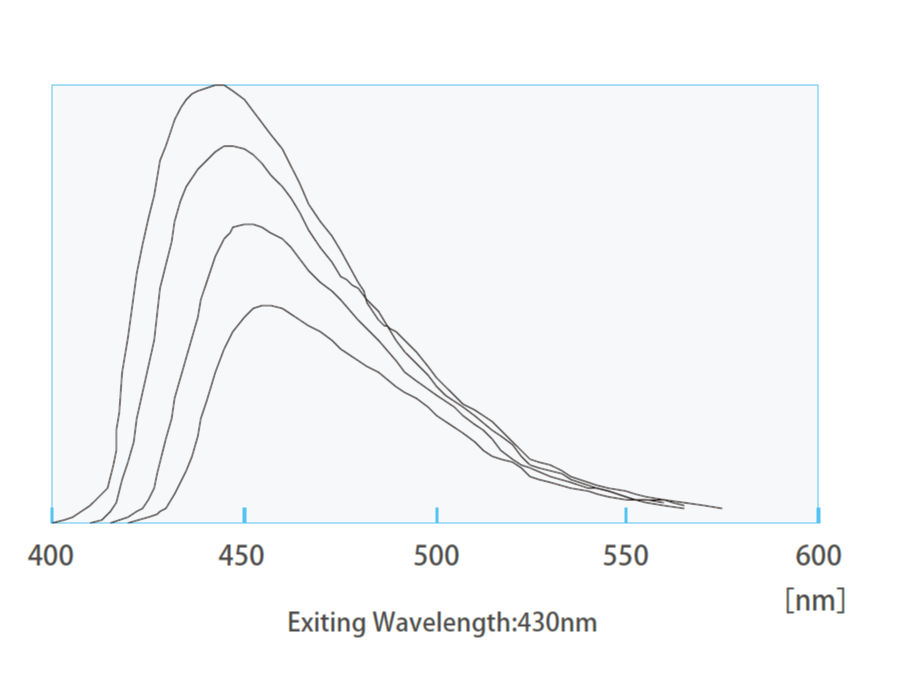
Y-8 (150)
Y-11 (200)
O-2 (100)
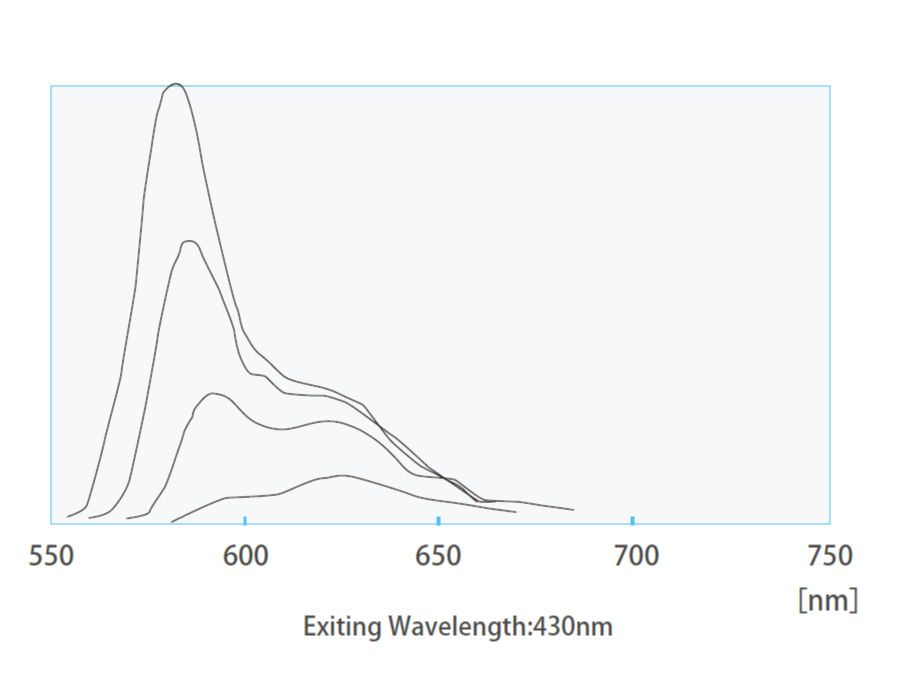
<R-3(100)>
<YS-1>
<YS-2>
<YS-4>
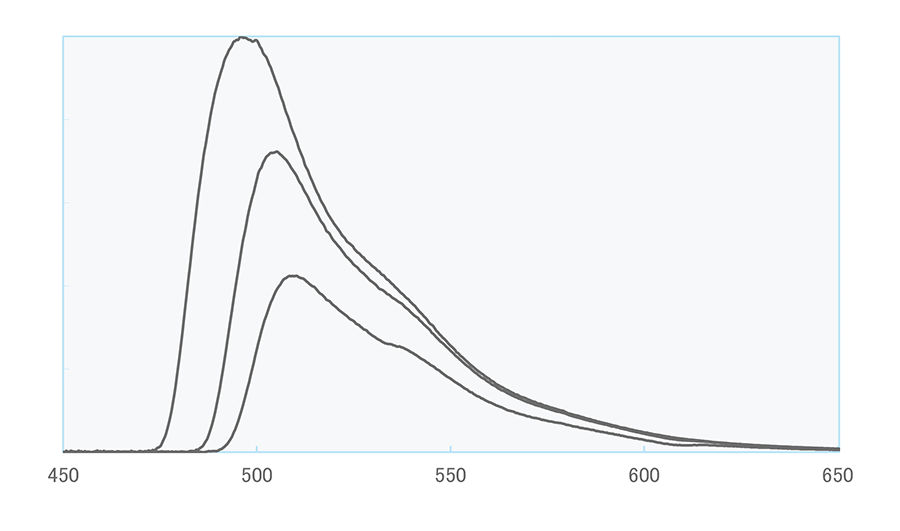
<YS-6>
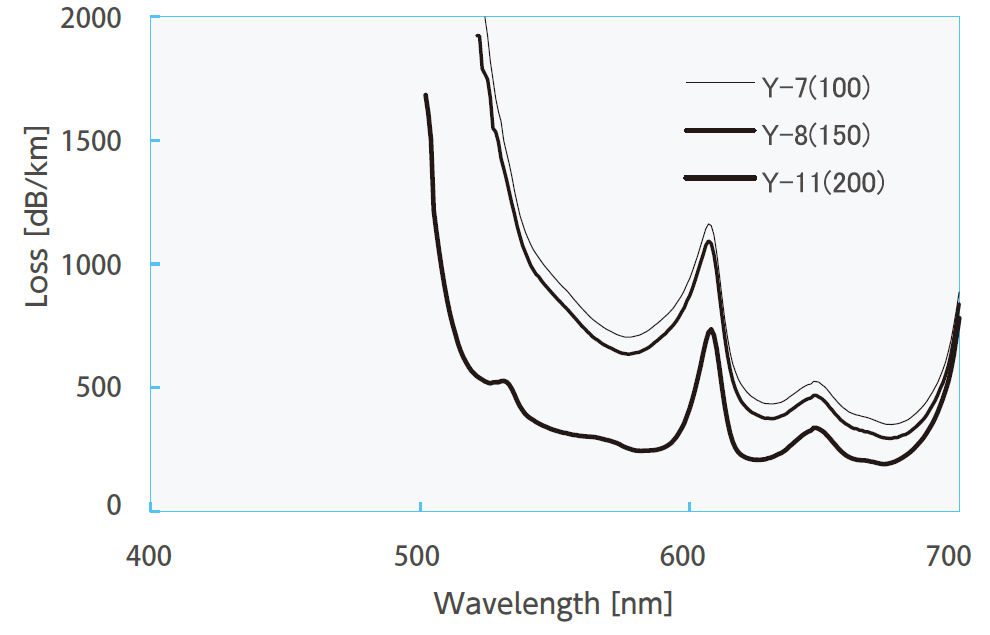
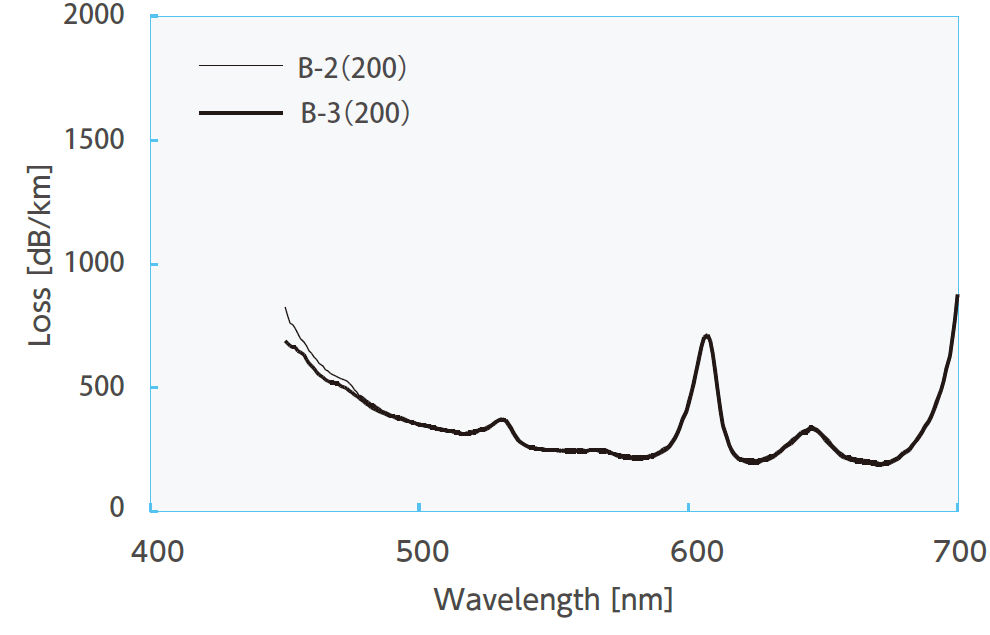
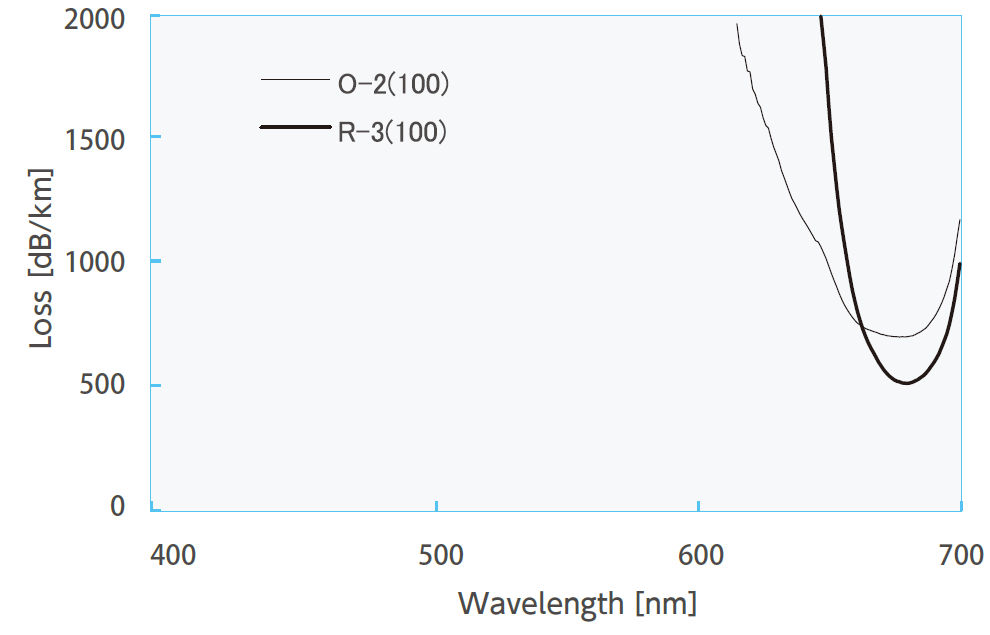
Technical Data (transmission loss)
The data shown are representative values for comparative study. Values may vary depending on measurement conditions. Not a guaranteed value.
Y-7, Y-8, Y-11
B-2, B-3
O-2, R-3
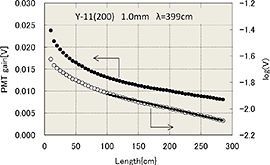
Attenuation Length Measurement Method
Attenuation lengths are regularly measured for all produced products using 3m fiber samples.
The decay curves in the figure (example) are approximated by the single exponential formula I(x) = I₀ exp(-x/λ) except at very short distances. The attenuation length λ is calculated using data between x = 100 cm and x = 300 cm.